 E-submission
Articles
- Page Path
- HOME > J Pathol Transl Med > Volume 46(2); 2012 > Article
-
Original Article
Markers for Screening Lynch Syndrome Are Reliable and Useful for Identifying the Specimen Mislabeling - Sun-ju Byeon, Jiwoon Choi, Kyung Han Nam, Bo-Gun Jang, Hee Eun Lee, Min A Kim, Woo Ho Kim
-
Korean Journal of Pathology 2012;46(2):131-136.
DOI: https://doi.org/10.4132/KoreanJPathol.2012.46.2.131
Published online: April 25, 2012
Department of Pathology, Seoul National University College of Medicine, Seoul, Korea.
- Corresponding Author: Woo Ho Kim, M.D. Department of Pathology, Seoul National University College of Medicine, 103 Daehak-ro, Jongno-gu, Seoul 110-799, Korea. Tel: +82-2-740-8269, Fax: +82-2-765-5600, woohokim@snu.ac.kr
© 2012 The Korean Society of Pathologists/The Korean Society for Cytopathology
This is an Open Access article distributed under the terms of the Creative Commons Attribution Non-Commercial License (http://creativecommons.org/licenses/by-nc/3.0) which permits unrestricted non-commercial use, distribution, and reproduction in any medium, provided the original work is properly cited.

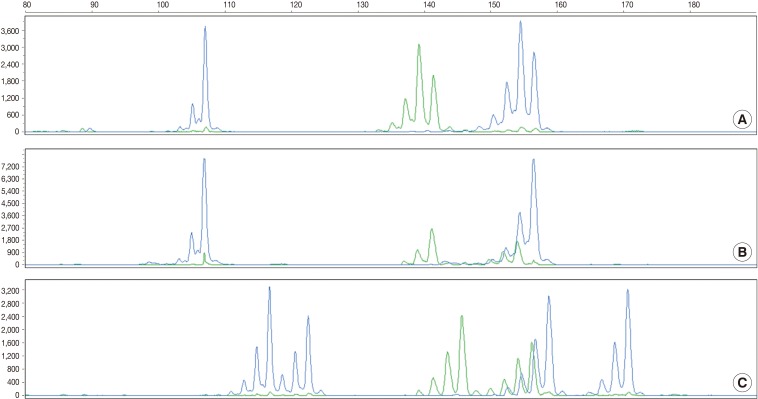
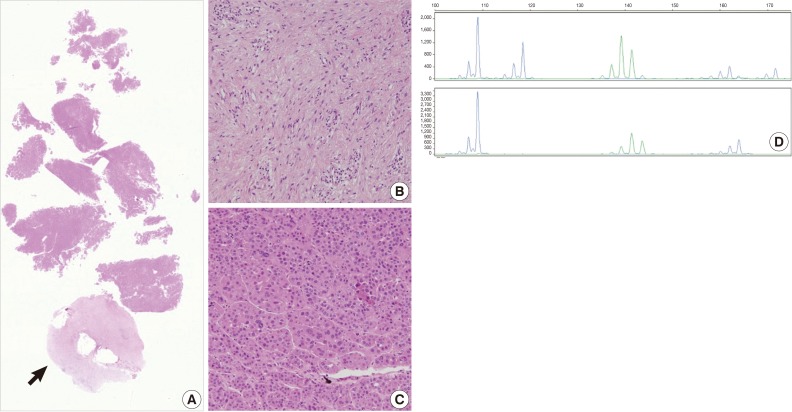
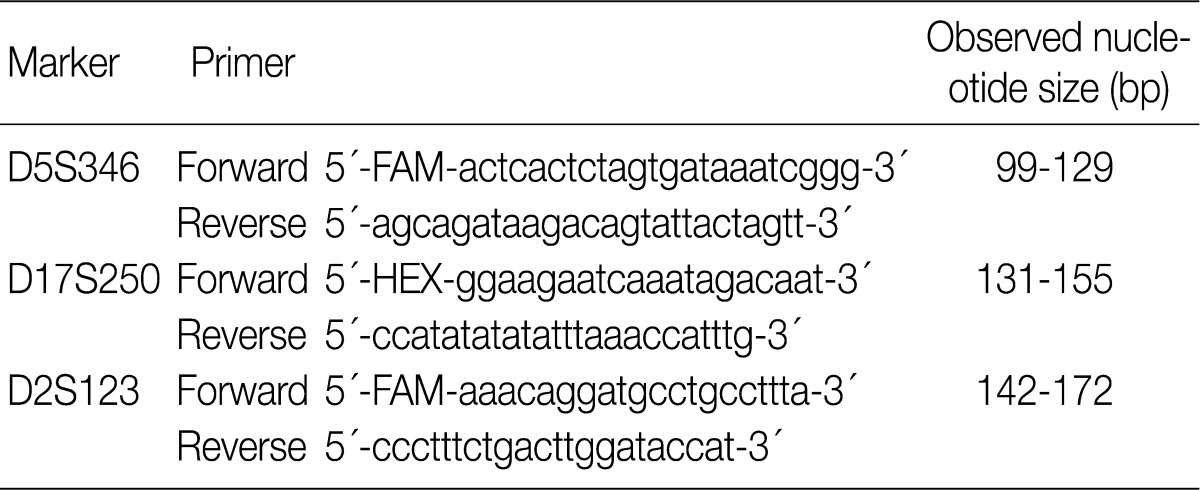

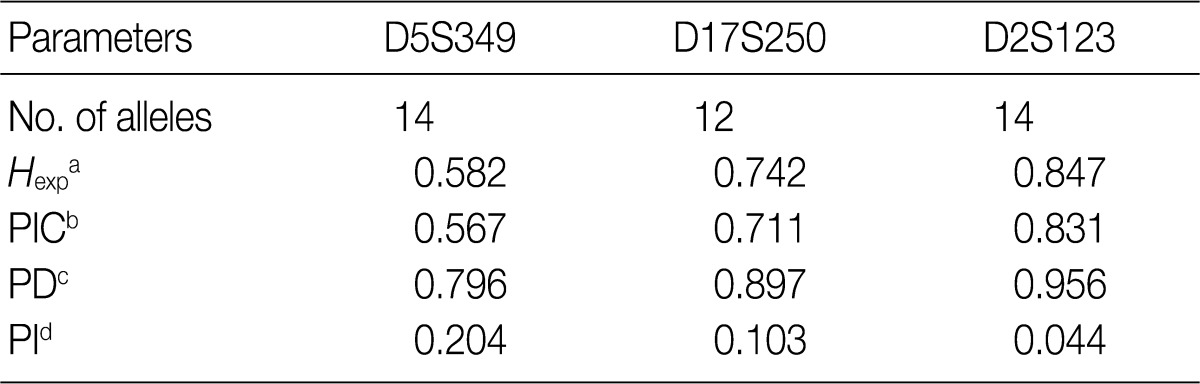
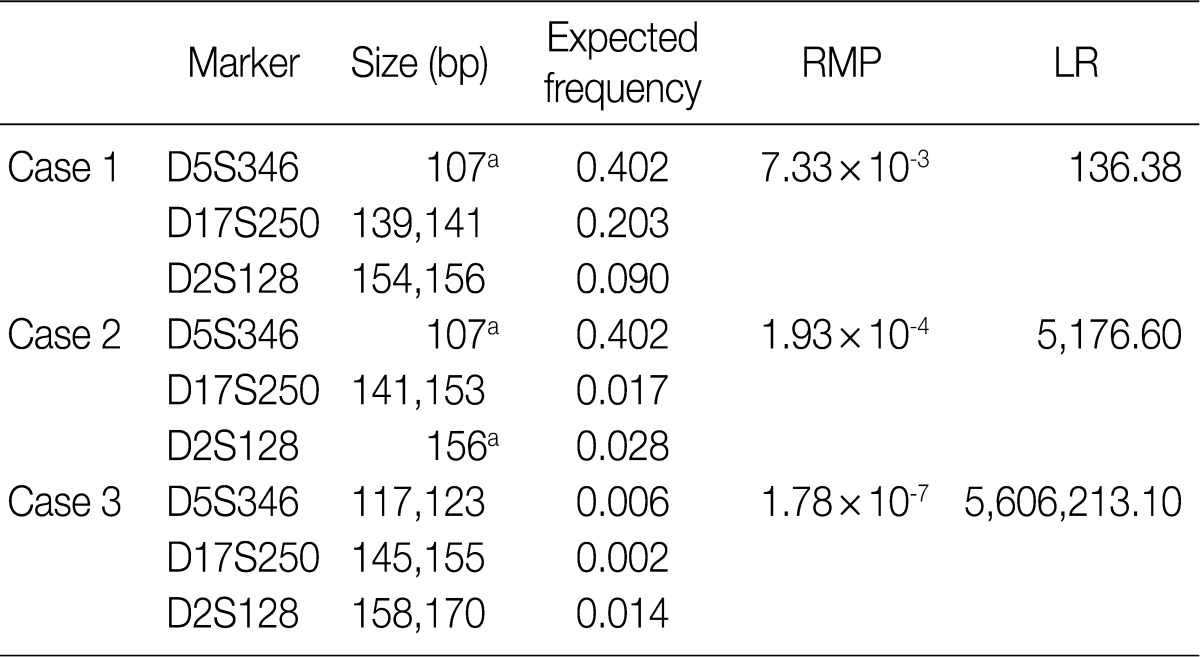
Figure & Data
References
Citations
- Lost, mislabeled, and mishandled surgical and clinical pathology specimens: A systematic review of published literature
Heather J Carmack, Braidyn S Lazenby, Kylie J Wilson, Jamie N Bakkum-Gamez, Leslie Carranza
American Journal of Clinical Pathology.2024; 162(4): 349. CrossRef - Sensitivity and polymorphism of Bethesda panel markers in Chinese population
Yanying Zheng, Jie Chen, Xiang Zhang, Ling Xie, Yifen Zhang, Yi Sun
Bulletin du Cancer.2020; 107(11): 1091. CrossRef
 PubReader
 Cite this Article


Fig. 1
Fig. 2
Fig. 3


Minimum allele frequency: 0.010 (When allele frequencies of estimated nucleotides length fall below the minimum allele frequency, then the minimum allele frequency is used instead).
aExpected heterozygosity; bPolymorphism information content (the probability that a given offspring of a parent carrying a rare allele at a locus will allow deduction of the parental genotype at the locus); cPower of discrimination (defined as PD=1-PI); dProbability of identity (matching probability, the probability that two individuals selected at random will have an identical genotype at the tested locus).
RMP, random match probability; LR, likelihood ratio. aHomozygote.

