 E-submission
Articles
- Page Path
- HOME > J Pathol Transl Med > Volume 47(1); 2013 > Article
-
Original Article
Alteration of the E-Cadherin/β-Catenin Complex Is an Independent Poor Prognostic Factor in Lung Adenocarcinoma - Hyojin Kim1, Seol Bong Yoo1,2, Pingli Sun1,3, Yan Jin1,4, Sanghoon Jheon3, Choon Taek Lee5, Jin-Haeng Chung1,4
-
Korean Journal of Pathology 2013;47(1):44-51.
DOI: https://doi.org/10.4132/KoreanJPathol.2013.47.1.44
Published online: February 25, 2013
1Department of Pathology, Seoul National University College of Medicine, Seoul, Korea.
2Department of Pathology, Presbyterian Medical Center, Jeonju, Korea.
3Department of Thoracic Surgery, Seoul National University Bundang Hospital, Seoul National University College of Medicine, Seongnam, Korea.
4Department of Pathology, Seoul National University Bundang Hospital, Seoul National University College of Medicine, Seongnam, Korea.
5Department of Internal Medicine, Seoul National University Bundang Hospital, Seoul National University College of Medicine, Seongnam, Korea.
- Corresponding Author: Jin-Haeng Chung, M.D., Ph.D. Department of Pathology, Seoul National University Bundang Hospital, 82 Gumi-ro 173beon-gil, Bundang-gu, Seongnam 463-707, Korea. Tel: +82-31-787-7713, Fax: +82-31-787-4012, chungjh@snu.ac.kr
© 2013 The Korean Society of Pathologists/The Korean Society for Cytopathology
This is an Open Access article distributed under the terms of the Creative Commons Attribution Non-Commercial License (http://creativecommons.org/licenses/by-nc/3.0/) which permits unrestricted non-commercial use, distribution, and reproduction in any medium, provided the original work is properly cited.


Figure & Data
References
Citations
- Prognostic significance of stem cell-related marker expression and its correlation with histologic subtypes in lung adenocarcinoma
Eunhyang Park, Soo Young Park, Ping-Li Sun, Yan Jin, Ji Eun Kim, Sanghoon Jheon, Kwhanmien Kim, Choon Taek Lee, Hyojin Kim, Jin-Haeng Chung
Oncotarget.2106; 7(27): 42502. CrossRef - E-cadherin–driven adherens junction reinforcement promotes spheroid-mediated invasion and progression in ALK–rearranged lung cancer chemoresistance
Dawon Hong, Hyun Jung Kwon, Jiwon Jeong, Seokhyun Yoon, Jin-Haeng Chung, Sunjoo Jeong
Molecules and Cells.2026; 49(4): 100329. CrossRef - Low E-cadherin expression is associated with poor prognosis in pulmonal adenocarcinoma
Fiete Gehrisch, Kiara A. Schmid, Martina Kluth, Georgia Makrypidi-Fraune, Katharina Möller, Maximilian Lennartz, Veit Bertram, Florian Lutz, Stefan Steurer, Philipp Busch, Birgit Hantzsch-Kuhn, Martin Reck, Till Olchers, David Benjamin Ellebrecht, Christo
Scientific Reports.2026;[Epub] CrossRef - Epigenetic Alterations of DNA Methylation and miRNA Contribution to Lung Adenocarcinoma
Wenhan Cai, Miao Jing, Jiaxin Wen, Hua Guo, Zhiqiang Xue
Frontiers in Genetics.2022;[Epub] CrossRef - Clinicopathological significance and prognostic value of E-cadherin expression in non-small cell lung cancer
Dong Chao, Gawei Hu, Qingxin Li
Medicine.2021; 100(7): e24748. CrossRef - Aberrant Expression of β-Catenin Correlates with Infiltrating Immune Cells and Prognosis in NSCLC
Hongmei Zheng, Yue Ning, Yang Yang, Yuting Zhan, Haihua Wang, Qiuyuan Wen, Jinwu Peng, Songqing Fan
Pathology and Oncology Research.2021;[Epub] CrossRef - Prognostic Significance of Wnt1, Wnt2, E-Cadherin, and β-catenin Expression in Operable Non-small Cell Lung Cancer
Anna Wrona, Aleksandra Sejda, Rafał Dziadziuszko, Jacek Jassem
Journal of Histochemistry & Cytochemistry.2021; 69(11): 711. CrossRef - Analysis of genes associated with prognosis of lung adenocarcinoma based on GEO and TCGA databases
Ye Yu, Xuemei Tian
Medicine.2020; 99(19): e20183. CrossRef - The roles of TG-interacting factor in cadmium exposure-promoted invasion and migration of lung cancer cells
Yadong Wang, Li Shi, Jiangmin Li, Haiyu Wang, Haiyan Yang
Toxicology in Vitro.2019; 61: 104630. CrossRef - Pizotifen inhibits the proliferation and invasion of gastric cancer cells
Ying Jiang, Wei Wang, Xi Wu, Jihua Shi
Experimental and Therapeutic Medicine.2019;[Epub] CrossRef - SNAI2 and TWIST1 in lymph node progression in early stages of NSCLC patients
Camille Emprou, Pauline Le Van Quyen, Jérémie Jégu, Nathalie Prim, Noëlle Weingertner, Eric Guérin, Erwan Pencreach, Michèle Legrain, Anne‐Claire Voegeli, Charlotte Leduc, Bertrand Mennecier, Pierre‐Emmanuel Falcoz, Anne Olland, Nicolas Santelmo, Elisabet
Cancer Medicine.2018; 7(7): 3278. CrossRef - E-Cadherin Loss Accelerates Tumor Progression and Metastasis in a Mouse Model of Lung Adenocarcinoma
Kerstin W. Sinkevicius, Kelly J. Bellaria, Juliana Barrios, Patrizia Pessina, Manav Gupta, Christine Fillmore Brainson, Roderick T. Bronson, Carla F. Kim
American Journal of Respiratory Cell and Molecular Biology.2018; 59(2): 237. CrossRef - Downregulation of peroxiredoxin II suppresses the proliferation and metastasis of gastric cancer cells
Linjun Niu, Ang Liu, Wei Xu, Liang Yang, Wugang Zhu, Yuming Gu
Oncology Letters.2018;[Epub] CrossRef - Implications of NOVA1 suppression within the microenvironment of gastric cancer: association with immune cell dysregulation
Eun Kyung Kim, Sun Och Yoon, Woon Yong Jung, Hyunjoo Lee, Youngran Kang, You-Jin Jang, Soon Won Hong, Seung Ho Choi, Woo Ick Yang
Gastric Cancer.2017; 20(3): 438. CrossRef - High FDG uptake on PET is associated with negative cell-to-cell adhesion molecule E-cadherin expression in lung adenocarcinoma
Kotaro Higashi, Yoshimichi Ueda, Miyako Shimasaki, Yasuhito Ishigaki, Yuka Nakamura, Manabu Oguchi, Tsutomu Takegami, Naoto Watanabe
Annals of Nuclear Medicine.2017; 31(8): 590. CrossRef - MicroRNA expression profiles and clinicopathological implications in lung adenocarcinoma according to EGFR, KRAS, and ALK status
Hyojin Kim, Jeong Mi Yang, Yan Jin, Sanghoon Jheon, Kwhanmien Kim, Choon Taek Lee, Jin-Haeng Chung, Jin Ho Paik
Oncotarget.2017; 8(5): 8484. CrossRef - A meta-analysis of abnormal β-catenin immunohistochemical expression as a prognostic factor in lung cancer: location is more important
Y. Yang, J. Shen, Jiaxi He, Jianxing He, G. Jiang
Clinical and Translational Oncology.2016; 18(7): 685. CrossRef - Aquaporin 1 Is an Independent Marker of Poor Prognosis in Lung Adenocarcinoma
Sumi Yun, Ping-Li Sun, Yan Jin, Hyojin Kim, Eunhyang Park, Soo Young Park, Kyuho Lee, Kyoungyul Lee, Jin-Haeng Chung
Journal of Pathology and Translational Medicine.2016; 50(4): 251. CrossRef - Prognostic Values of Vimentin Expression and Its Clinicopathological Significance in Non-Small Cell Lung Cancer: A Meta-Analysis of Observational Studies with 4118 Cases
Zhihua Ye, Xin Zhang, Yihuan Luo, Shikang Li, Lanshan Huang, Zuyun Li, Ping Li, Gang Chen, Aamir Ahmad
PLOS ONE.2016; 11(9): e0163162. CrossRef - Myoferlin expression in non-small cell lung cancer: Prognostic role and correlation with VEGFR-2 expression
DAE HYUN SONG, GYUNG HYUCK KO, JEONG HEE LEE, JONG SIL LEE, GYEONG-WON LEE, HYEON CHEOL KIM, JUNG WOOK YANG, ROK WON HEO, GU SEOB ROH, SUN-YOUNG HAN, DONG CHUL KIM
Oncology Letters.2016; 11(2): 998. CrossRef - Short hairpin RNA silencing of TGF-βRII and FZD-7 synergistically suppresses proliferation and metastasis of hepatocellular carcinoma cells
CONG CHEN, YUYANG XUE, DEJUN ZHANG, WEI XU, HAO XU, HONG YAO, DONGSHENG PEI, YUMING GU
Oncology Letters.2016; 11(3): 2039. CrossRef - NOVA1 inhibition by miR-146b-5p in the remnant tissue microenvironment defines occult residual disease after gastric cancer removal
Sun Och Yoon, Eun Kyung Kim, Mira Lee, Woon Yong Jung, Hyunjoo Lee, Youngran Kang, You-Jin Jang, Soon Won Hong, Seung Ho Choi, Woo Ick Yang
Oncotarget.2016; 7(3): 2475. CrossRef - Immunohistochemical demonstration of alteration of β-catenin during tumor metastasis by different mechanisms according to histology in lung cancer
XIANHUA XU, JI EUN KIM, PING-LI SUN, SEOL BONG YOO, HYOJIN KIM, YAN JIN, JIN-HAENG CHUNG
Experimental and Therapeutic Medicine.2015; 9(2): 311. CrossRef - FRK Inhibits Migration and Invasion of Human Glioma Cells by Promoting N-cadherin/β-catenin Complex Formation
Qiong Shi, Xu Song, Jun Wang, Jia Gu, Weijian Zhang, Jinxia Hu, Xiuping Zhou, Rutong Yu
Journal of Molecular Neuroscience.2015; 55(1): 32. CrossRef - Dissociation of E-cadherin/β-catenin complex by MG132 and bortezomib enhances CDDP induced cell death in oral cancer SCC-25 cells
Lanhai Lü, Xiqiang Liu, Cheng Wang, Fengchun Hu, Jianning Wang, Hongzhang Huang
Toxicology in Vitro.2015; 29(8): 1965. CrossRef - Epigallocatechin-3-gallate inhibits nicotine-induced migration and invasion by the suppression of angiogenesis and epithelial-mesenchymal transition in non-small cell lung cancer cells
JINGLI SHI, FEI LIU, WENZHANG ZHANG, XIN LIU, BIHUA LIN, XUDONG TANG
Oncology Reports.2015; 33(6): 2972. CrossRef - Clinicopathologic and prognostic significance of c-MYC copy number gain in lung adenocarcinomas
A N Seo, J M Yang, H Kim, S Jheon, K Kim, C T Lee, Y Jin, S Yun, J-H Chung, J H Paik
British Journal of Cancer.2014; 110(11): 2688. CrossRef - The Clinicopathological Significance of Epithelial Mesenchymal Transition Associated Protein Expression in Head and Neck Squamous Cell Carcinoma
Kyu Ho Kim, Lucia Kim, Suk Jin Choi, Jee Young Han, Joon Mee Kim, Young Chae Chu, Young-Mo Kim, In Suh Park, Joo Han Lim
Korean Journal of Pathology.2014; 48(4): 263. CrossRef - Adenoid dysplasia of the oral mucosa
Belinda Bunn, Keith Hunter, Syed Ali Khurram, W.F.P. van Heerden
Oral Surgery, Oral Medicine, Oral Pathology and Oral Radiology.2014; 118(5): 586. CrossRef - FGFR1 amplification is associated with poor prognosis and smoking in non-small-cell lung cancer
An Na Seo, Yan Jin, Hee Jin Lee, Ping-Li Sun, Hyojin Kim, Sanghoon Jheon, Kwhanmien Kim, Choon-Taek Lee, Jin-Haeng Chung
Virchows Archiv.2014; 465(5): 547. CrossRef - FNC, a Novel Nucleoside Analogue, Blocks Invasion of Aggressive Non-Hodgkin Lymphoma Cell Lines Via Inhibition of the Wnt/β-Catenin Signaling Pathway
Yan Zhang, Chen-Ping Wang, Xi-Xi Ding, Ning Wang, Fang Ma, Jin-Hua Jiang, Qing-Duan Wang, Jun-Biao Chang
Asian Pacific Journal of Cancer Prevention.2014; 15(16): 6829. CrossRef - β-Catenin overexpression is associated with gefitinib resistance in non-small cell lung cancer cells
Xia Fang, Pan Gu, Caicun Zhou, Aibin Liang, Shenxiang Ren, Fang Liu, Yu Zeng, Yunjin Wu, Yinmin Zhao, Binbin Huang, Zongmei Zhang, Xianghua Yi
Pulmonary Pharmacology & Therapeutics.2014; 28(1): 41. CrossRef - Tumor‐size‐based morphological features of metastatic lymph node tumors from primary lung adenocarcinoma
Eiji Yamada, Genichiro Ishii, Nao Aramaki, Keiju Aokage, Tomoyuki Hishida, Junji Yoshida, Motohiro Kojima, Kanji Nagai, Atsushi Ochiai
Pathology International.2014; 64(12): 591. CrossRef - Prognostic and Clinicopathological Significance of Downregulated E-Cadherin Expression in Patients with Non-Small Cell Lung Cancer (NSCLC): A Meta-Analysis
Yan-Long Yang, Ming-Wu Chen, Lei Xian, Alfons Navarro
PLoS ONE.2014; 9(6): e99763. CrossRef - Hepatic Stellate Cells Secreted Hepatocyte Growth Factor Contributes to the Chemoresistance of Hepatocellular Carcinoma
Guofeng Yu, Yingying Jing, Xingrui Kou, Fei Ye, Lu Gao, Qingmin Fan, Yang Yang, Qiudong Zhao, Rong Li, Mengchao Wu, Lixin Wei, Xin-Yuan Guan
PLoS ONE.2013; 8(9): e73312. CrossRef - A Comprehensive Comparative Analysis of the Histomorphological Features of ALK-Rearranged Lung Adenocarcinoma Based on Driver Oncogene Mutations: Frequent Expression of Epithelial-Mesenchymal Transition Markers than Other Genotype
Hyojin Kim, Se Jin Jang, Doo Hyun Chung, Seol Bong Yoo, Pingli Sun, Yan Jin, Kyung Han Nam, Jin-Ho Paik, Jin-Haeng Chung, Alfredo Fusco
PLoS ONE.2013; 8(10): e76999. CrossRef - Non-small cell lung cancer cells survived ionizing radiation treatment display cancer stem cell and epithelial-mesenchymal transition phenotypes
Roberto Gomez-Casal, Chitralekha Bhattacharya, Nandita Ganesh, Lisa Bailey, Per Basse, Michael Gibson, Michael Epperly, Vera Levina
Molecular Cancer.2013;[Epub] CrossRef
 PubReader
 ePub Link
-
 Cite this Article
- Cite this Article
-
- Close
- Download Citation
- Close
- Figure
-
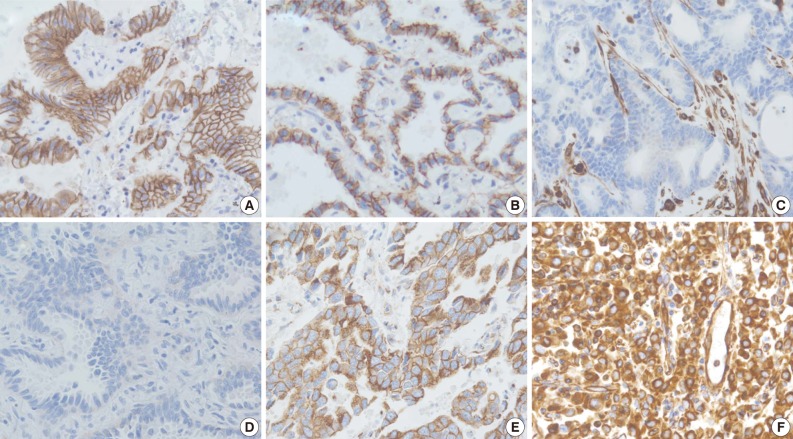
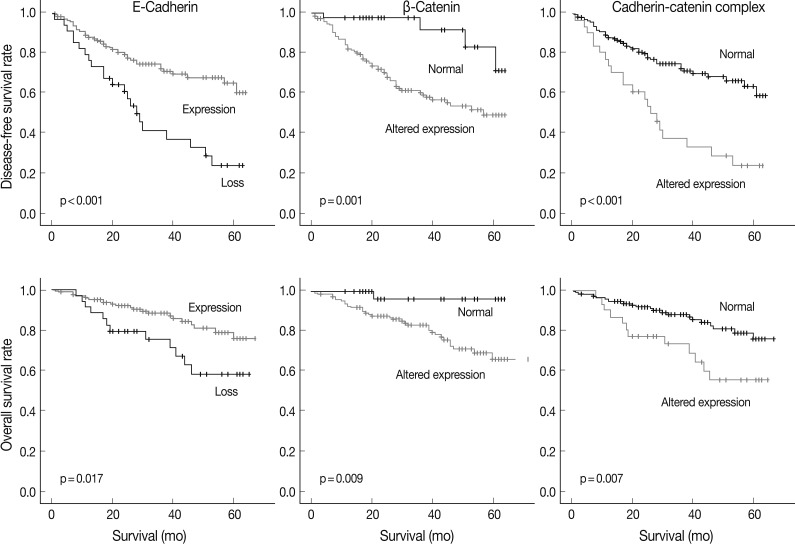


Fig. 1
Fig. 2
| Characteristics | No. of examined | E-Cadherin |
p-value | β-Catenin |
p-value | Vimentin |
p-value | |||
|---|---|---|---|---|---|---|---|---|---|---|
| Negative | Expression | Aberrant expression | Normal | Expression | Normal | |||||
| Total | 193 (100) | |||||||||
| Sex | ||||||||||
| Male | 90 (46.6) | 20 (22.2) | 70 (77.8) | 0.084 | 71 (78.9) | 19 (21.1) | 0.489 | 27 (30.0) | 63 (70.0) | 0.282 |
| Female | 103 (53.3) | 14 (13.6) | 89 (86.4) | 80 (77.7) | 23 (22.3) | 26 (25.2) | 77 (74.8) | |||
| Age (yr) | ||||||||||
| ≤ 65 | 79 (40.9) | 12 (15.2) | 67 (84.8) | 0.295 | 60 (75.9) | 19 (24.1) | 0.32 | 23 (29.1) | 56 (70.9) | 0.394 |
| > 65 | 114 (59.1) | 22 (19.3) | 92 (80.7) | 91 (79.8) | 23 (20.2) | 30 (26.3) | 84 (73.7) | |||
| Smoking history | ||||||||||
| No | 115 (59.6) | 15 (13.0) | 100 (87.0) | 0.034 |
92 (80.0) | 23 (20.0) | 0.292 | 33 (28.7) | 82 (71.3) | 0.383 |
| Yes | 78 (40.4) | 19 (24.4) | 59 (75.9) | 59 (75.6) | 19 (24.4) | 20 (25.6) | 58 (74.4) | |||
| Tumor size (cm) | ||||||||||
| ≤ 3 | 127 (65.8) | 17 (13.4) | 110 (86.6) | 0.028 |
92 (72.4) | 35 (27.6) | 0.004 |
32 (25.2) | 95 (74.8) | 0.209 |
| > 3 | 66 (34.2) | 17 (25.8) | 49 (74.2) | 59 (89.4) | 7 (10.6) | 21 (31.8) | 45 (68.2) | |||
| Pleural invasion | ||||||||||
| Absent | 132 (67.9) | 17 (13.0) | 114 (87.0) | 0.013 |
93 (71.0) | 38 (29.0) | <0.001 |
29 (22.1) | 102 (77.9) | 0.014 |
| Present | 62 P2.1) | 17 (27.4) | 45 (72.6) | 58 (93.5) | 4 (6.5) | 24 (38.7) | 38 (61.3) | |||
| Lymphatic invasion | ||||||||||
| Absent | 124 (64.2) | 18 (14.5) | 106 (85.5) | 0.095 | 88 (71.0) | 36 (29.0) | 0.001 |
31 (25.0) | 93 (75.0) | 0.195 |
| Present | 69 (35.8) | 16 (23.2) | 53 (76.8) | 63 (91.3) | 6 (8.7) | 22 (31.9) | 47 (68.1) | |||
| Vascular invasion | ||||||||||
| Absent | 174 (90.2) | 27 (15.5) | 147 (84.5) | 0.029 |
133 (76.4) | 41 (23.6) | 0.051 | 48 (27.6) | 126 (72.4) | 0.573 |
| Present | 19 (9.8) | 7 (36.8) | 12 (63.2) | 18 (94.7) | 1 (5.3) | 5 (26.3) | 14 (73.7) | |||
| Stage | ||||||||||
| I | 126 (65.3) | 17 (13.5) | 109 (86.5) | 0.023 |
88 (69.8) | 38 (30.2) | <0.001 |
33 (26.2) | 93 (73.8) | 0.921 |
| II | 23 (11.9) | 4 (17.4) | 19 (82.6) | 20 (87.0) | 3 (13.0) | 9 P9.1) | 14 (60.9) | |||
| III | 44 (22.8) | 13 (29.5) | 31 (70.55) | 43 (97.7) | 1 (2.3) | 11 (25.0) | 33 (75.0) | |||
| Correlation coefficients ρ (n = 193) |
|||
|---|---|---|---|
| E-Cadherin | β-Catenin | Vimentin | |
| E-Cadherin | 1 | 0.145 |
-0.051 |
| β-Catenin | 1 | -0.24 |
|
| Vimentin | 1 | ||
| Characteristics | No. of examined | Altered caherin-catenin complex |
||
|---|---|---|---|---|
| Alteration | Normal | p-value | ||
| Total | 193 (100) | |||
| Sex | ||||
| Male | 90 (46.6) | 18 (20.0) | 72 (80.05) | 0.116 |
| Female | 103 (53.3) | 13 (12.6) | 90 (87.4) | |
| Age (yr) | ||||
| ≤ 65 | 79 (40.9) | 11 (13.9) | 68 (86.1) | 0.32 |
| > 65 | 114 (59.1) | 20 (17.5) | 94 (82.5) | |
| Smoking history | ||||
| No | 115 (59.6) | 13 (11.3) | 102 (88.7) | 0.024 |
| Yes | 78 (40.4) | 18 (23.1) | 60 (76.9) | |
| Tumor size (cm) | ||||
| ≤ 3 | 127 (65.8) | 15 (11.8) | 112 (88.2) | 0.023 |
| > 3 | 66 (34.2) | 16 (24.2) | 50 (75.8) | |
| Pleural invasion | ||||
| Absent | 132 (67.9) | 16 (12.2) | 115 (87.8) | 0.030 |
| Present | 62 (32.1) | 15 (24.2) | 47 (75.8) | |
| Lymphatic invasion | ||||
| Absent | 124 (64.2) | 16 (12.9) | 108 (87.1) | 0.083 |
| Present | 69 (35.8) | 15 (21.7) | 54 (78.3) | |
| Vascular invasion | ||||
| Absent | 174 (90.2) | 25 (14.4) | 149 (85.6) | 0.061 |
| Present | 19 (9.8) | 6 (31.6) | 13 (68.4) | |
| Stage | ||||
| I | 126 (65.3) | 15 (11.9) | 111 (88.1) | |
| II | 23 (11.9) | 4 (17.4) | 19 (82.6) | 0.020 |
| III | 44 (22.8) | 12 (27.3) | 32 (72.7) | |
| Predominant subtype of adenocarcinoma | Altered cadherin-catenin complex |
||
|---|---|---|---|
| Alteration | Normal | p-value | |
| Acinar predominant | 25 (17.9) | 115 (82.1) | >0.05 |
| Papillary predominant | 1 (16.7) | 5 (83.3) | |
| Lepidic predominant | 2 (7.7) | 24 (92.3) | |
| Solid predominant | 3 (16.7) | 15 (83.3) | |
| Micropapillary predominant | 0 | 2 (100) | |
| Invasive mucinous adenocarcinoma | 0 | 1 (100) | |
| Prognostic factors | Hazard ratio (95% CI) | p-value |
|---|---|---|
| Cadherin-catenin complex | 1.926 (1.119-3.314) | 0.018 |
| Alteration vs normal | ||
| Pleural invasion | ||
| Present vs absent | 1.071 (0.942-1.513) | 0.458 |
| Pathologic stage | ||
| II vs I | 2.928 (1.387-6.183) | 0.005 |
| III vs I | 6.034 (3.292-11.060) | < 0.001 |
Values are presented as number (%). p<0.05.
p<0.05.
Values are presented as number (%). p<0.05.
Values are presented as number (%). EMT, epithelial-mesenchymal transition.
CI, confidence interval. p<0.05.

